


A Range of Calculations
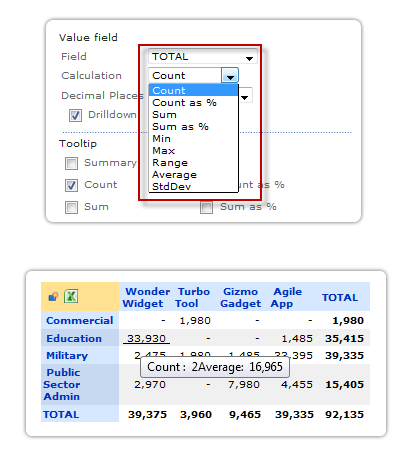 Really get to grips with your data by having PivotPoint perform a range of mathematical functions.
Maybe you want to see:
- The total value of sales for each of your products this year.
- The average number of cases each of your customer advisors is handling in a day.
- The percentage of unpaid invoices that are more than 60 days old.
PivotPoint can handle all these and more. Output the results of your calculation as a chart or a table, or both, and keep you up to date with changes in the situation as your list data changes.
Full range of calculations available:
- Sum
- Sum as %
- Count
- Count as %
- Average
- Range
- Minimum
- Maximum
- Standard Deviation
With Tooltips in the table view you can view a number of calculations simultaneously, saving so much data analysis time and effort.